Trends
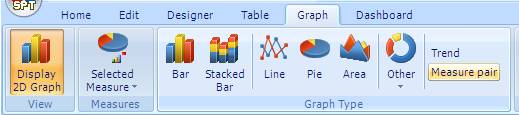
If you want to see trend lines and forecast for your data select
button Trend.
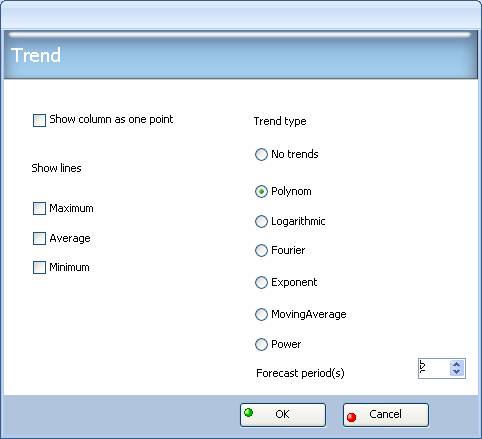
On the dialog select trend type and if you want forecast
periods:
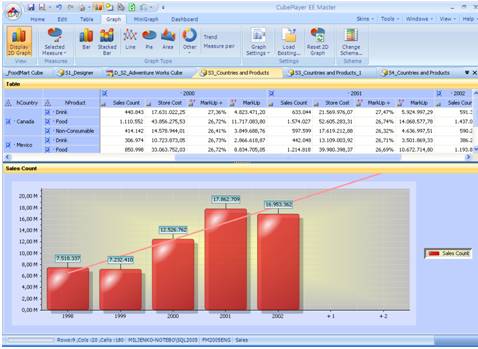
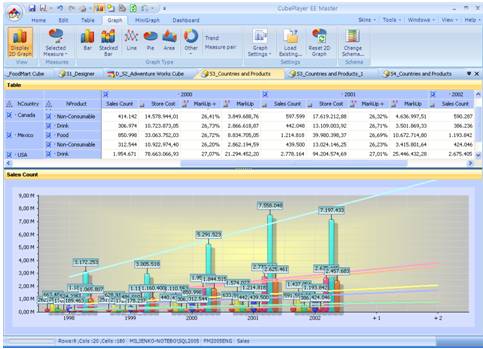
Since your default graph was stacked bar, CubePlayer will
automatically apply “show as one point”
feature and entire column will be in one color:
If your starting graph was bar (non
stacked):
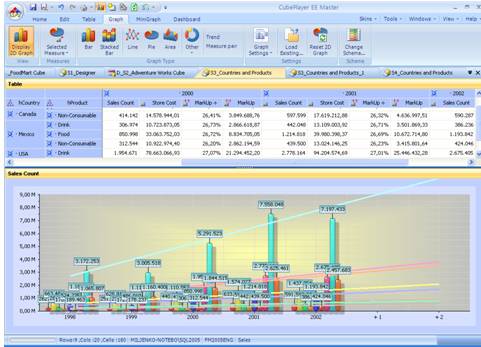
and if you turn on same trend type and same forecast
period:
you will get trends for each data point inside one
column.